class-12 summary
EASILY CREATE STUNNING ANIMATED CHARTS WITH CHART.JS
- Charts are much better than tables for presenting and conveying data. A great way to get started with charts is with Chart.js, a JavaScript plugin that uses HTML5’s canvas element to draw the graph onto the page. It is using all kinds of bar charts, line charts, pie charts, and more, incredibly easy.
- The great things about Chart.js are that it’s simple to use and really very flexible.
- The first thing we need to do is download Chart.js then create a canvas element in HTML in which Chart.js can draw the chart.After that,write a script that will retrieve the context of the canvas and inside the same script tags create the data.
Basic usage of canvas
- The < canvas > element doesn’t have the src and alt attributes like img . It has only two attributes, width and height. These are both optional and can also be set using DOM properties.
- If the renderings seem distorted, try specifying the width and height attributes explicitly in the < canvas > attributes, and not using CSS.
- Providing a useful fallback text or sub DOM helps to make the canvas more accessible.
- The < canvas > element requires the closing tag (</ canvas>). If this tag is not present, the rest of the document would be considered the fallback content and wouldn’t be displayed.
- The < canvas > element creates a fixed-size drawing surface that exposes one or more rendering contexts, which are used to create and manipulate the content shown.The canvas is initially blank. To display something, a script first needs to access the rendering context and draw on it. The < canvas > element has a method called getContext(), used to obtain the rendering context and its drawing functions. getContext() takes one parameter, the type of context.The first line in the script retrieves the node in the DOM representing the < canvas > element by calling the document.getElementById() method. Once you have the element node, you can access the drawing context using its getContext() method.
Drawing shapes with canvas
- The Canvas grid or Coordinate System : By default, the coordinate system starts at the top left. (X: 0, Y: 0) Moving down or to the right increases X and Y positions.

- The < canvas > element supports two primitive shapes: rectangles and paths (lists of points connected by lines). All other shapes must be created by combining one or more paths.
- There are three functions that draw rectangles on the canvas:
- fillRect(x, y, width, height) Draws a filled rectangle.
- strokeRect(x, y, width, height) Draws a rectangular outline.
- clearRect(x, y, width, height) Clears the specified rectangular area, making it fully transparent.
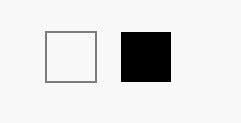
- A path is a list of points, connected by segments of lines that can be of different shapes, curved or not, of different width, and of a different color. A path, or even a subpath, can be closed. To make shapes using paths, we take some extra steps:
- First, you create the path.
- Then you use drawing commands to draw into the path.
- Once the path has been created, you can stroke or fill the path to render it. Here are the functions used to perform these steps:
- beginPath() Creates a new path. Once created, future drawing commands are directed into the path and used to build the path up.
- Path methods Methods to set different paths for objects.
- closePath() Adds a straight line to the path, going to the start of the current sub-path.
- stroke() Draws the shape by stroking its outline.
- fill() Draws a solid shape by filling the path’s content area.
- The first step to create a path is to call the beginPath(). Internally, paths are stored as a list of sub-paths (lines, arcs, etc) which together form a shape. Every time this method is called, the list is reset and we can start drawing new shapes.
- moveTo(x, y) : Moves the pen to the coordinates specified by x and y. We can use to place the starting point somewhere or to draw unconnected paths.
- lineTo(x, y) : Draws a line from the current drawing position to the position specified by x and y.
- arc(x, y, radius, startAngle, endAngle, anticlockwise) : Draws an arc which is centered at (x, y) position with radius r starting at startAngle and ending at endAngle going in the given direction indicated by anticlockwise (defaulting to clockwise).
- arcTo(x1, y1, x2, y2, radius) Draws an arc with the given control points and radius, connected to the previous point by a straight line.
- The anticlockwise parameter is a Boolean value which, when true, draws the arc anticlockwise; otherwise, the arc is drawn clockwise.
- Note: Angles in the arc function are measured in radians, not degrees. To convert degrees to radians you can use the following JavaScript expression: radians = (Math.PI/180)*degrees.
- quadraticCurveTo(cp1x, cp1y, x, y) : Draws a quadratic Bézier curve from the current pen position to the end point specified by x and y, using the control point specified by cp1x and cp1y.
- bezierCurveTo(cp1x, cp1y, cp2x, cp2y, x, y) : Draws a cubic Bézier curve from the current pen position to the end point specified by x and y, using the control points specified by (cp1x, cp1y) and (cp2x, cp2y).
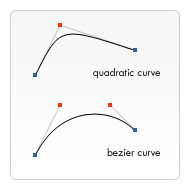
- A quadratic Bézier curve has a start and an end point (blue dots) and just one control point (indicated by the red dot) while a cubic Bézier curve uses two control points.
- rect(x, y, width, height) Draws a rectangle whose top-left corner is specified by (x, y) with the specified width and height.
- The Path2D() constructor returns a newly instantiated Path2D object, optionally with another path as an argument (creates a copy), or optionally with a string consisting of SVG path data.
- The Path2D API also adds a way to combine paths using the addPath method. This can be useful when you want to build objects from several components.
Applying styles and colors:
- If we want to apply colors to a shape, there are two important properties we can use: fillStyle and strokeStyle.
- fillStyle = color’string’ : Sets the style used when filling shapes.
- strokeStyle = color’string’ : Sets the style for shapes’ outlines.
- In addition to drawing opaque shapes to the canvas, we can also draw semi-transparent (or translucent) shapes. This is done by either setting the globalAlpha property or by assigning a semi-transparent color to the stroke and/or fill style.
- globalAlpha = transparencyValue : Applies the specified transparency value to all future shapes drawn on the canvas. The value must be between 0.0 (fully transparent) to 1.0 (fully opaque). This value is 1.0 (fully opaque) by default.
-
The rgba() function is similar to the rgb() function but it has one extra parameter. The last parameter sets the transparency value of this particular color. The valid range is again between 0.0 (fully transparent) and 1.0 (fully opaque).
- There are several properties which allow us to style lines.
- lineWidth = value : Sets the width”thickness” of lines drawn in the future.
- lineCap = type : Sets the appearance of the ends of lines.There are three possible values for this property and those are: butt, round and square. By default this property is set to butt.
- lineJoin = type : Sets the appearance of the “corners” where lines meet.There are three possible values for this property: round, bevel and miter. By default this property is set to miter.
- miterLimit = value Establishes a limit on the miter when two lines join at a sharp angle, to let you control how thick the junction becomes.” miterLimit = max miterLength / lineWidth = 1 / sin ( min θ / 2 )”
- getLineDash() Returns the current line dash pattern array containing an even number of non-negative numbers.
- setLineDash(segments) Sets the current line dash pattern.
- lineDashOffset = value Specifies where to start a dash array on a line.
- Gradients methods :
- createLinearGradient(x1, y1, x2, y2) Creates a linear gradient object with a starting point of (x1, y1) and an end point of (x2, y2).
- createRadialGradient(x1, y1, r1, x2, y2, r2) Creates a radial gradient. The parameters represent two circles, one with its center at (x1, y1) and a radius of r1, and the other with its center at (x2, y2) with a radius of r2.
- createConicGradient(angle, x, y) Creates a conic gradient object with a starting angle of angle in radians, at the position (x, y).
- gradient.addColorStop(position, color) Creates a new color stop on the gradient object. The position is a number between 0.0 and 1.0 and defines the relative position of the color in the gradient, and the color argument must be a string representing a CSS < color >, indicating the color the gradient should reach at that offset into the transition.
- createPattern(image, type) Creates and returns a new canvas pattern object. image is a CanvasImageSource (that is, an HTMLImageElement, another canvas, a < video > element, or the like. type is a string indicating how to use the image.The type specifies how to use the image in order to create the pattern, and must be one of the following string values:
- repeat : Tiles the image in both vertical and horizontal directions.
- repeat-x : Tiles the image horizontally but not vertically.
- repeat-y : Tiles the image vertically but not horizontally.
- no-repeat : Doesn’t tile the image. It’s used only once.
- Using shadows involves just four properties:
- shadowOffsetX = float : Indicates the horizontal distance the shadow should extend from the object. This value isn’t affected by the transformation matrix. The default is 0.
- shadowOffsetY = float : Indicates the vertical distance the shadow should extend from the object. This value isn’t affected by the transformation matrix. The default is 0.
- shadowBlur = float : Indicates the size of the blurring effect; this value doesn’t correspond to a number of pixels and is not affected by the current transformation matrix. The default value is 0.
- shadowColor = color A standard CSS color value indicating the color of the shadow effect; by default, it is fully-transparent black.
- The canvas rendering context provides two methods to render text:
- fillText(text, x, y [, maxWidth]) Fills a given text at the given (x,y) position. Optionally with a maximum width to draw.
- strokeText(text, x, y [, maxWidth]) Strokes a given text at the given (x,y) position. Optionally with a maximum width to draw.
- measureText() Returns a TextMetrics object containing the width, in pixels, that the specified text will be when drawn in the current text style.